
Abstract |
Hong Kong is a high energy-demand city. Burning fossil fuels e.g. coal, oil and natural gas during electricity generation releases greenhouse gases and pollutants into the atmosphere. Due to the rapid scale of economic and population growth, anthropogenic greenhouse gas emissions have increased and are now higher than ever (IPCC, 2014). The greenhouse gases will accelerate the insulating effect in the atmosphere and also are the major causative factors in global warming. The mitigation of climate change has become a major public objective, and using renewable energy is one method to achieve this. In order to encourage the usage of solar photovoltaic (PV) technology in Hong Kong, this study aims at utilizing Geographic Information Systems (GIS), Remote Sensing (RS) and airborne LiDAR technology to determine appropriate locations e.g. available rooftop areas, and total potential output power for the deployment of solar photovoltaic systems in Hong Kong. In addition, in order to derive a spatial cloud cover map for Hong Kong, geostationary satellite images from the Multi-functional Transport Satellite (MTSAT) were acquired and used for cloud mapping. The land utilization map of Hong Kong (LUM HK), digital elevation model (DEM)/ digital surface model (DSM), building GIS data and tertiary planning unit (TPU) data were also used as ancillary data.
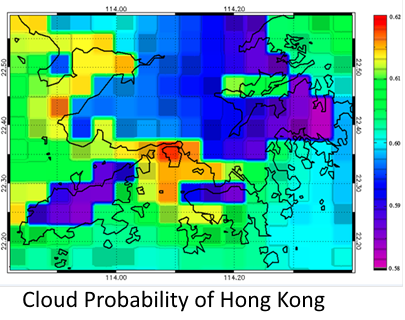
(1). Satellite data
In order to derive a cloud cover probability map for Hong Kong, the Multi-functional Transport Satellite (MTSAT) series (MTSAT-1R /MTSAT-2) images were acquired and used in this study. It covers the Earth’s surface from 5° N to 55° N in latitude and from 75° E to 145° E in longitude and has hourly-based temporal resolution. The acquired data are the post-processed products at 4 km spatial resolution of visible channel and infrared channel. All MTSAT image files are stored in HDF-4 format, and it consists of seven layers: VIS, IR1, IR2, IR3, IR4, Latitude, and Longitude.
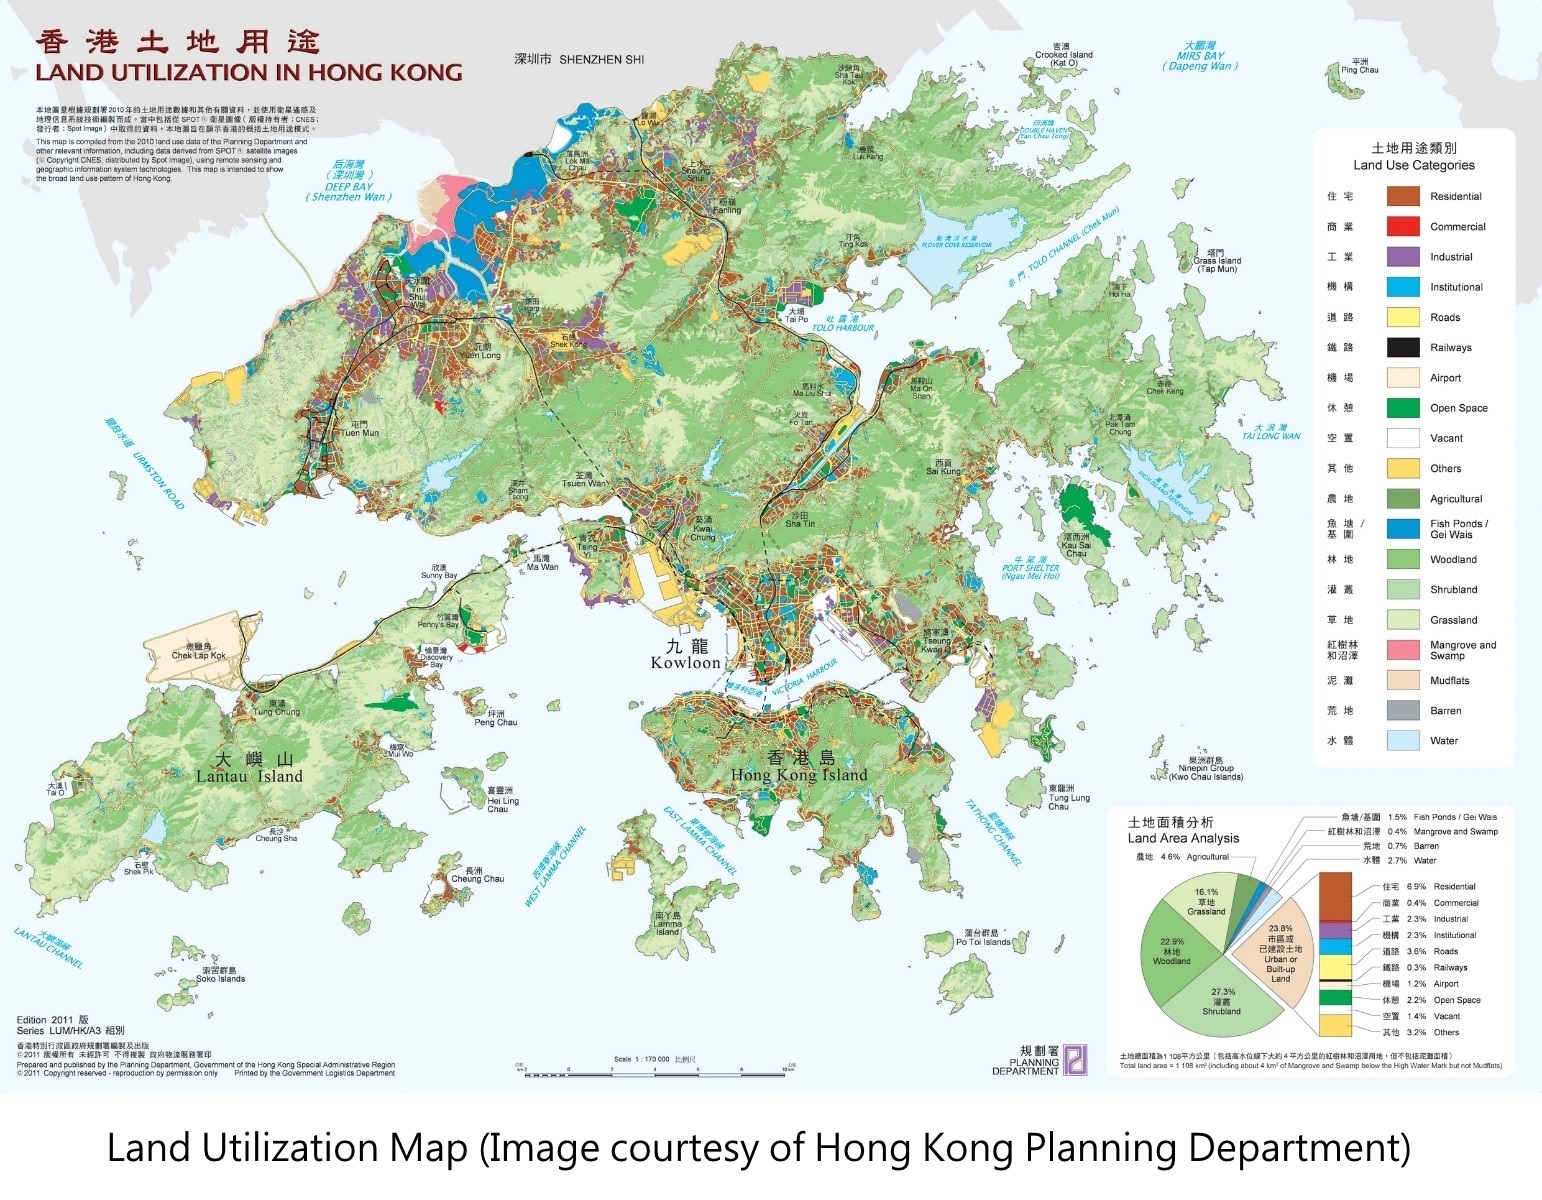 (2). 2012 Land Utilization Map
The Land Utilization Map of Hong Kong (LUM HK) is prepared annually by the Hong Kong Planning Department. The updating of the LUM HK exercise employs Geographical Information Systems (GIS) and Remote Sensing (RS) technologies to prepare a Land Utilization Map (LUM) covering the built-up and non built-up areas of Hong Kong respectively. The map presents broad land use patterns for the entire territory of Hong Kong at a scale of 1:75,000, with 28 classification categories. The 2011 LUM was acquired and used in this study.
(2). 2012 Land Utilization Map
The Land Utilization Map of Hong Kong (LUM HK) is prepared annually by the Hong Kong Planning Department. The updating of the LUM HK exercise employs Geographical Information Systems (GIS) and Remote Sensing (RS) technologies to prepare a Land Utilization Map (LUM) covering the built-up and non built-up areas of Hong Kong respectively. The map presents broad land use patterns for the entire territory of Hong Kong at a scale of 1:75,000, with 28 classification categories. The 2011 LUM was acquired and used in this study.
3). Elevation data - Hong Kong DEM / DSM
The Digital Surface Model (DSM) and Digital Terrain Model (DTM) data are available for this research. They are generated by the airborne Light Detection and Ranging (LiDAR) point cloud data and in raster format. The data acquisition was carried out by the Civil Engineering and Developing Department (CEDD) with airborne laser scanner. The data processing has to be transformed the point cloud data into DSM and DTM. The spatial resolution of the DTM and DSM is 1 m². The LiDAR data covering entire Hong Kong territory were used in this study.
(4). Hong Kong Building GIS data
The building GIS data are in polygon shapefile format with all building footprints in Hong Kong. Each polygon represents the corresponding building in object space. In the attribute table, each polygon contains a list of attributes including area, geo-reference number and building names. The GIS data were used to extract the building pixels and export the potential PV of individual building.
(5). Tertiary Planning Unit data
Tertiary Planning Units (TPU) data in year 2011 were acquired, with the entire territory of Hong Kong divided by 289 TPUs from the Hong Kong Planning Department. These TPUs are aggregated under 52 Secondary Planning Units (SPUs) and 9 Primary Planning Units (PPUs).
The Intergovernmental Panel on Climate Change (IPCC) (2007). Summary or policymakers. Climate change 2014: Synthesis report