Red Tide Monitoring |
Extensive algal blooms or red tide events occur around Hong Kong in
late summer or early autumn. These algal blooms are mostly dominated
by diatoms and dinoflagellates, which cause massive mortalities of
aquaculture fish and numerous ecological and health impacts.
Recently a massive red tide (over 500 hectares) with the scientific
name Karenia brevis, was reported in the eastern coastal waters of
Shenzhen, near Dameisha beach, Shenzhen China on 25 November 2014.
Several red tide events were observed along other coasts of Hong
Kong during this period. When anomalously high Chl-a concentration
levels are detected in coastal waters, these are indicators for a
potential algal bloom. Therefore, to test the robustness of the
developed models, these were applied to the Landsat 8 Operational
Land Imager (OLI) image of 25 November 2014. The model was found to
be capable of mapping the extremely high Chl-a concentrations of
greater than 60 µg/l (Figure 2 c) for the affected area. Most areas
within the red tide had a Chl-a concentration range from 30–40 µg/l,
and highest values (greater than 60 µg/l) were only found within the
central part of the red tide. The true color aerial photograph of
the area on the same date (Figure 2 d) indicates extremely high
concentrations of phytoplankton across the region. Continuous
monitoring of algal blooms, based on remote sensing models can
assist in early identification of algal blooms including their
intensity and extent.
Hong Kong has a complex marine
environment due to terrestrial discharges from the Pearl River Delta
in the west, urban pollutants in the centre and the clearer waters
of the South China Sea in the east. Monitoring this complex
near-shore environment requires retrieval of water quality
parameters such as Chl-a and SS concentrations at high spatial and
temporal resolutions.
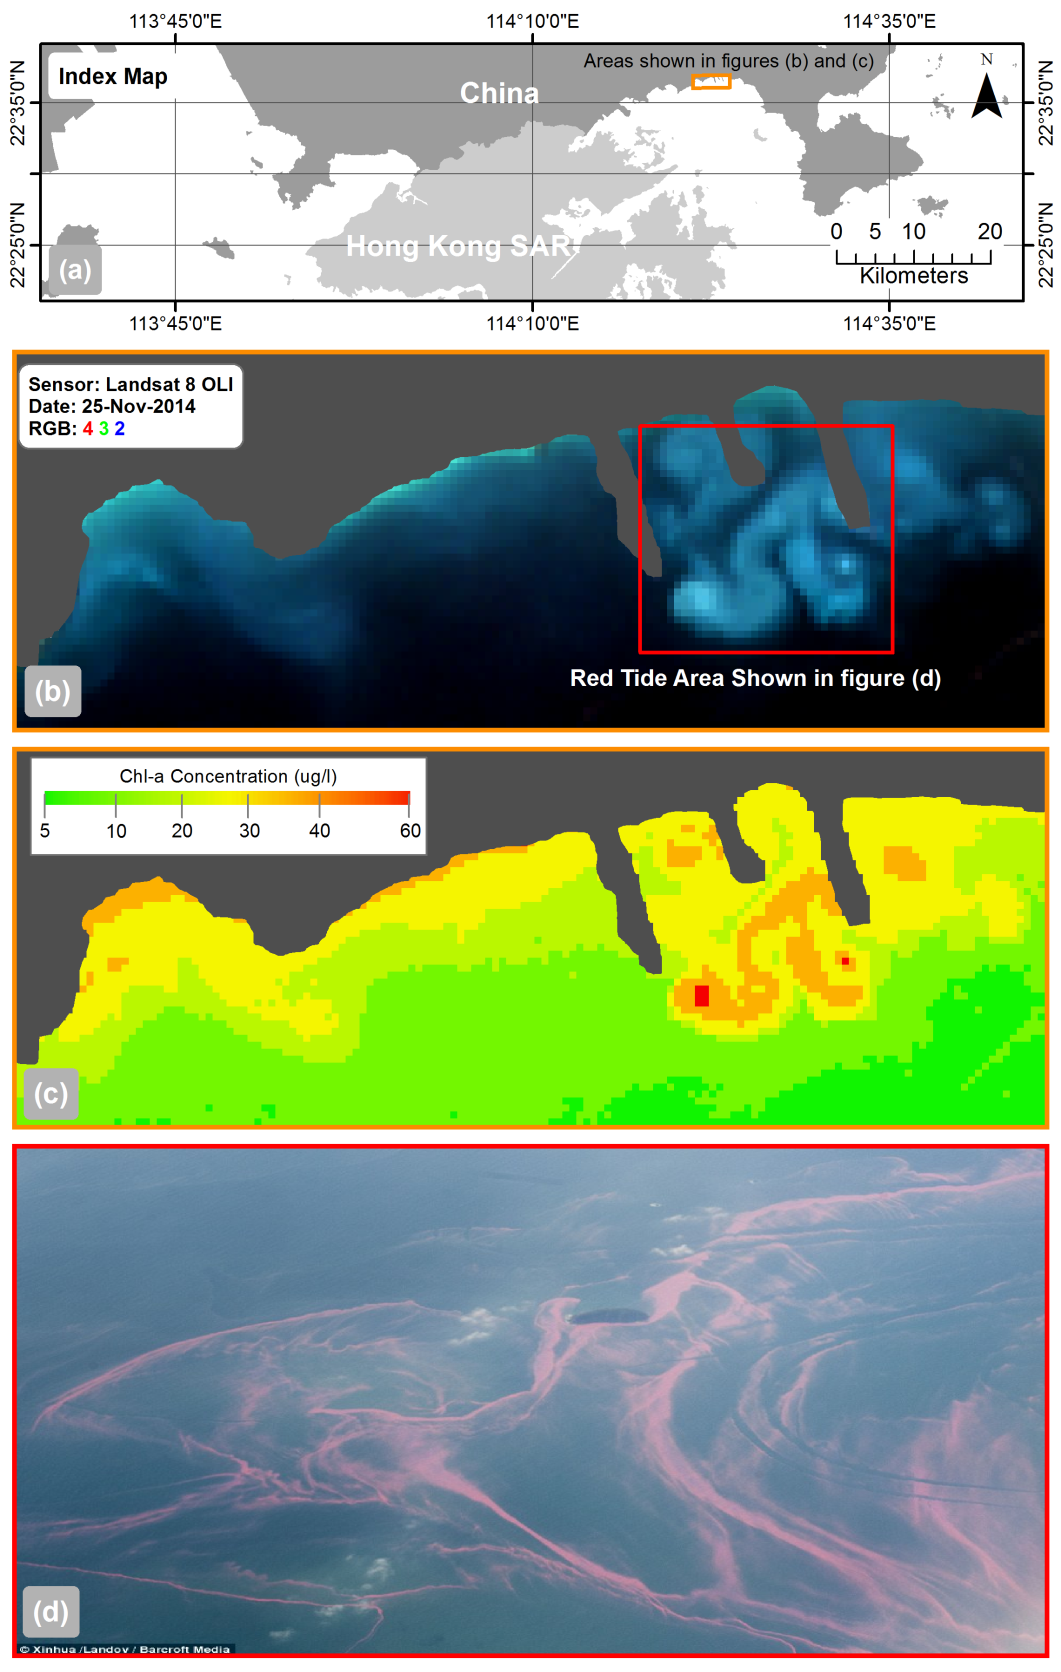
This image is the chlorophyll-a concentration map for the eastern coastal waters of Shenzhen affected by red tide (a) index map, (b) true color image of Landsat 8 Operational Land Imager (OLI) sensor acquired on 25 November 2014, (c) Chl-a concentration map of the red tide affected area (d) aerial photograph of the main red tide affected area (photo credits Xinhua).