Results |
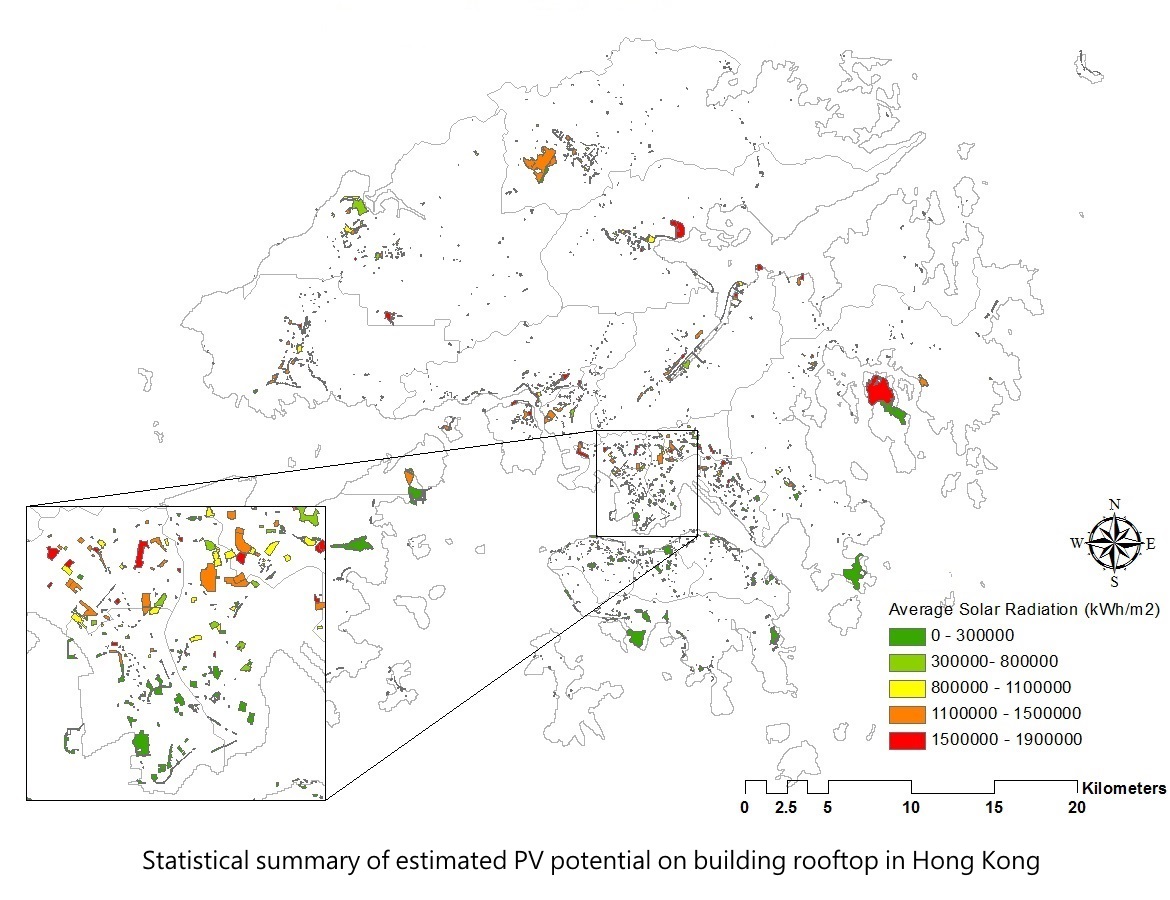
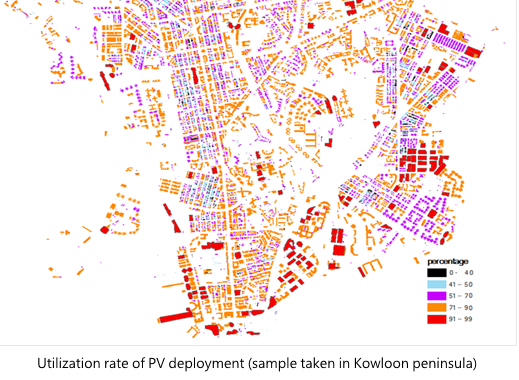
Solar radiation and number of PV panels can determine the amount of generated electricity in PV system. It indicates that the viewshed and area of installation are important to the performance of PV system. Hong Kong contains about 309,606 buildings, 233,152 buildings are suitable to install solar panel. The sum of PV potential is about 2.43 TWh. However, the mean potential PV is only about 10.427 MWh. The map below shows the feasibility of the PV system installed on individual buildings. It is also observed that the large buildings have a larger percentage of PV deployment than the small buildings. In this map, about 10% of buildings have utilization rate below 40%, most of them are residential buildings.
The table below lists the analysed result of all building rooftops in Hong Kong. There are 233,152 buildings which are suitable for implementing the PV system. The total solar radiation received by building rooftop is 31 TWh in 2012 and the total output energy is about 2.43 TWh. Thus, the average output for each building is about 10.427 MWh. The maximum annual solar radiation in building rooftop is about 160 GWh. The total area of PV employment on rooftop area is about 28,643,335 m2 and average solar radiation is 1773 kWh. The utilization ratio is calculated by dividing the optimal PV area with the area of building rooftops. The maximum utilization ratio of PV installation is 0.98 and the averaged utilization ratio is 0.51.

The total and average PV potential in residential region is larger than the commercial region. It indicates that the efficiency and total generation of electricity in residential region is higher that the commercial region. However, it is observed that, the efficiency of residential buildings in commercial region is lower than the commercial buildings which contain a larger rooftop area. It is because the commercial district contains lots of skyscrapers. The skyscrapers obstruct the viewshed of the short buildings nearby. Therefore, the solar radiation incident on the PV is greatly reduced. In the residential area, the buildings are spatially distributed. It greatly reduces the chance of obstruction from surrounding buildings. Some of the buildings, especially for the village houses in Yuen Long, are relatively short and have good viewsheds. A better viewshed gives a higher efficiency in generation of electricity.
The residential buildings have the lowest utilization rate but industrial buildings have greatest utilization rate. The industrial buildings usually locate at a less crowded district and with larger rooftop areas. As a result, the PV systems on industrial rooftops can generate electricity at the highest efficiency.
Associate the Land Utilization map in 2011 below with the estimated PV potential in buildings by spatial join, the electricity generation in different type of land uses can be accounted. The table below shows the statistical data of performance of PV panels according to different land uses. There are 40 types of land uses.
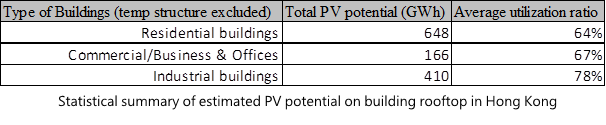
Three types of major buildings are extracted for comparison at the table below: industrial buildings, residential buildings and commercial buildings. A column named “utilization ratio” is defined as the estimated areas of installation divided by the areas of rooftop. It indicates the feasibility of the PV system deployment. The residential buildings provide 648 GWh energy with utilization ratio of 64%. Meanwhile, the commercial buildings provide 166 GWh with utilization ratio of 67% and industrial buildings provide 410 GWh with utilization ratio of 78%. It indicates that the industrial buildings are capable to employ PV system efficiently and residential buildings can produce the largest amount of electricity.
There are about 24,217,705 m² open spaces in Hong Kong, and some are suitable for installing the PV modules. The total estimated energy in these 2,475 open spaces are 38 TWh, the highest average solar radiation is around 2,066 kWh/m², and the average solar radiation is 16 GWh. In the 2,475 open space area, most of them have large unused areas which can receive direct significant solar energy. Figure below illustrated the average solar radiation map of open spaces. The areas with higher average solar radiation can be interpreted as orange and red parcels.